Project activity by modality
Traffic and Vehicle Simulation
TrafficSimulators_GettingStartedWithDifferrentSimulators_GettingStartedWithCARLA: Launch page to get started with CARLA. (IVSG - PSU internal)
TrafficSimulators_GettingStartedWithDifferrentSimulators_GettingStartedWithSUMO:Launch page to get started with SUMO. (IVSG - PSU internal)
TrafficSimulators_GettingStartedWithDifferrentSimulators_GettingStartedWithCARLA-SUMOCosimulation: Launch page to get started with CARLA-SUMO cosimulation. (IVSG - PSU internal)
The following table shows the three roadway situations for the simulation: urban, artirial and highway, including the location we picked in State College and the corresponding data link.
Situations |
Urban |
|---|---|
Ciity |
PA, State College |
Location Description |
|
Site Number |
1134 |
Data Time |
Nov 16, 2016 |
Peak Time |
8AM |
Peak Volume |
696 |
Off-peak Time |
1PM |
Off-peak Volume |
368 |
Link to Real Traffic Data |
|
Situations |
Arterial |
Ciity |
PA, State College |
Location Description |
|
Site Number |
1136 |
Data Time |
Nov 16, 2016 |
Peak Time |
5PM |
Peak Volume |
2374 |
Off-peak Time |
9AM |
Off-peak Volume |
1212 |
Link to Real Traffic Data |
|
Situations |
Highway |
Ciity |
PA, State College |
Location Description |
|
Site Number |
1180 |
Data Time |
Dec 05, 2016 |
Peak Time |
4PM |
Peak Volume |
4046 |
Off-peak Time |
9AM |
Off-peak Volume |
2321 |
Link to Real Traffic Data |
The following table shows the summary about whether the considered three roadway situations could be applied to each of the proposed 20 scenarios.
Scenario |
Scenario Summary |
Urban |
Arterial |
Highway |
Uploaded to DMS |
|---|---|---|---|---|---|
0 |
ANALYSIS OF VARIANCE |
Y |
Y |
Y |
Urban peak volume Urban off-peak volume Arterial peak volume Arterial off-peak volume |
1.1 |
|
Y |
Y |
Y |
Urban peak volume |
1.2 |
|
Y |
Y |
Y |
|
1.3 |
|
N |
N |
Y |
|
1.4 |
|
N |
N |
Y |
|
1.5 |
|
Y |
Y |
N |
|
1.6 |
|
N |
N |
Y |
|
2.1 |
|
Y |
Y |
Y |
|
2.2 |
|
Y |
Y |
Y |
|
2.3 |
LANE SHIFT TO TEMPORARY ROADWAY |
Y |
Y |
Y |
|
2.4 |
|
Y |
Y |
Y |
|
3.1 |
|
Y |
Y |
Y |
|
4.1a |
|
Y |
Y |
Y |
|
4.1b |
|
N |
N |
Y |
|
4.2 |
|
N |
N |
Y |
|
4.3 |
|
N |
N |
Y |
|
5.1a |
|
Y |
Y |
Y |
|
5.1b |
|
N |
N |
Y |
|
5.2 |
|
Y |
Y |
Y |
|
6.1 |
|
Y |
Y |
Y |
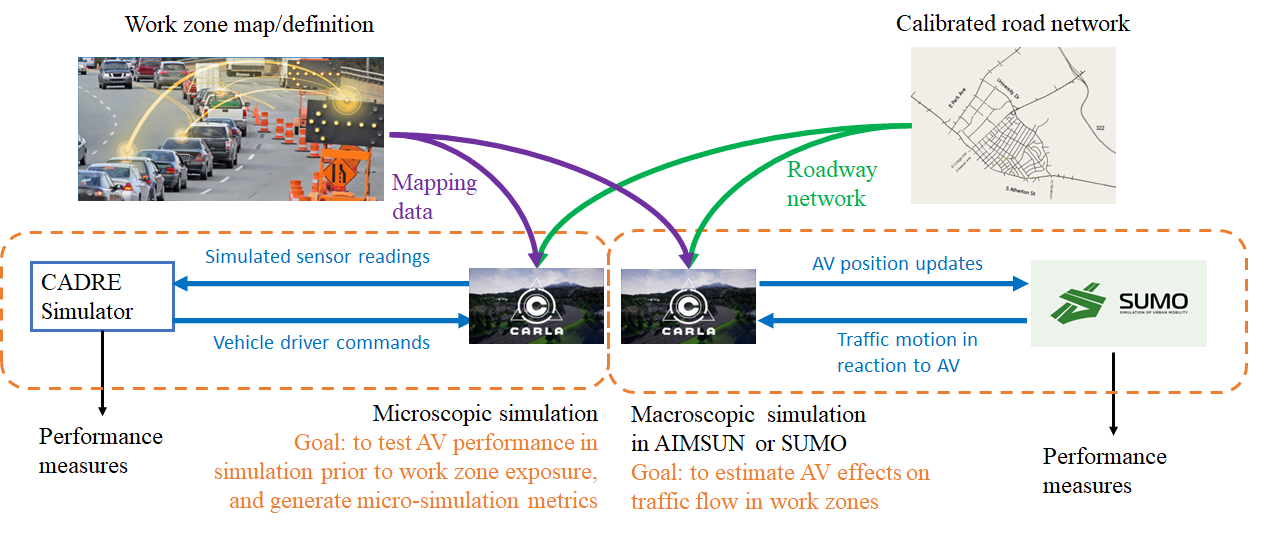
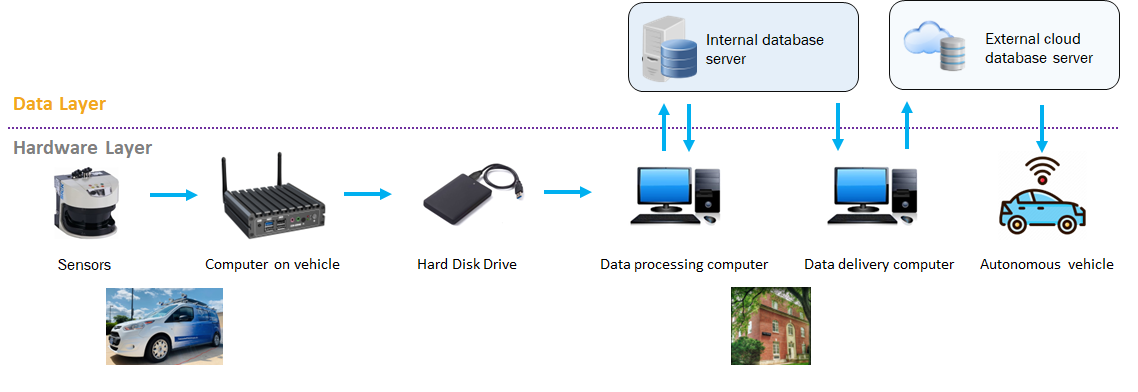
The data flow of the simulation is below:
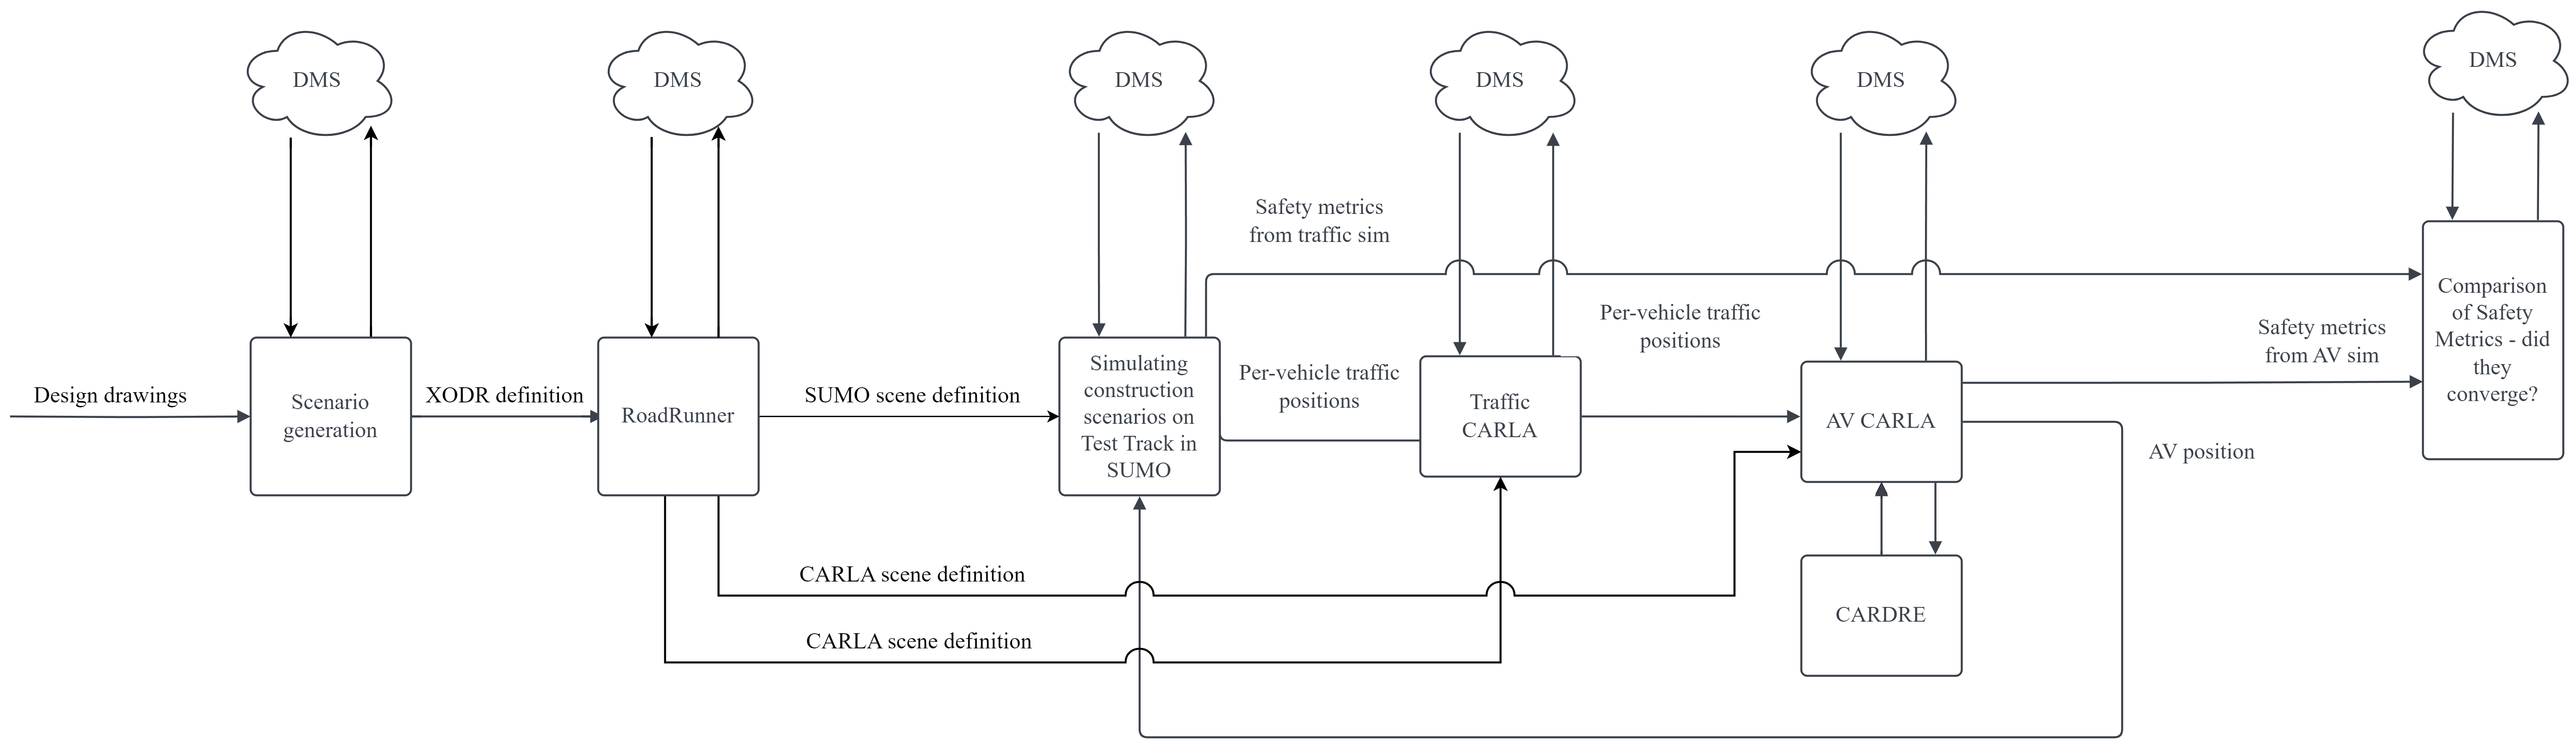
Simulating construction scenarios:
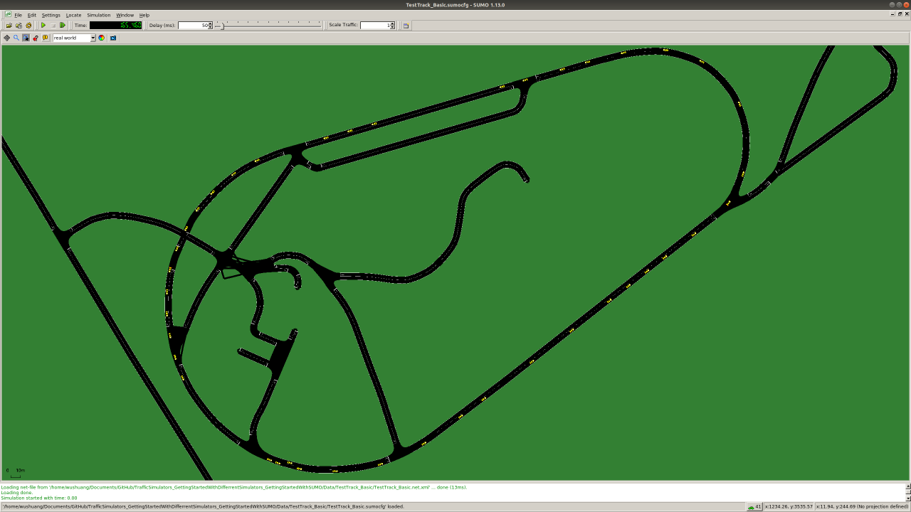
Simulating a traffic flow on Penn State test track: The work in this area involves information to guide how to simulate a traffic flow on Penn State test track. (IVSG - PSU internal)
The following table shows the three roadway situations for the simulation: urban, artirial and highway, including the location we picked in State College and the corresponding data link.
Situations |
Urban |
|---|---|
Ciity |
PA, State College |
Location Description |
|
Site Number |
1134 |
Data Time |
Nov 16, 2016 |
Peak Time |
8AM |
Peak Volume |
696 |
Off-peak Time |
1PM |
Off-peak Volume |
368 |
Link to Real Traffic Data |
|
Situations |
Arterial |
Ciity |
PA, State College |
Location Description |
|
Site Number |
1136 |
Data Time |
Nov 16, 2016 |
Peak Time |
5PM |
Peak Volume |
2374 |
Off-peak Time |
9AM |
Off-peak Volume |
1212 |
Link to Real Traffic Data |
|
Situations |
Highway |
Ciity |
PA, State College |
Location Description |
|
Site Number |
1180 |
Data Time |
Dec 05, 2016 |
Peak Time |
4PM |
Peak Volume |
4046 |
Off-peak Time |
9AM |
Off-peak Volume |
2321 |
Link to Real Traffic Data |
The following table shows the summary about whether the considered three roadway situations could be applied to each of the proposed 20 scenarios.
Scenario |
Scenario Summary |
Urban |
Arterial |
Highway |
Uploaded to DMS |
|---|---|---|---|---|---|
0 |
ANALYSIS OF VARIANCE |
Y |
Y |
Y |
Urban peak volume Urban off-peak volume Arterial peak volume Arterial off-peak volume |
1.1 |
|
Y |
Y |
Y |
Urban peak volume |
1.2 |
|
Y |
Y |
Y |
|
1.3 |
|
N |
N |
Y |
|
1.4 |
|
N |
N |
Y |
|
1.5 |
|
Y |
Y |
N |
|
1.6 |
|
N |
N |
Y |
|
2.1 |
|
Y |
Y |
Y |
|
2.2 |
|
Y |
Y |
Y |
|
2.3 |
LANE SHIFT TO TEMPORARY ROADWAY |
Y |
Y |
Y |
|
2.4 |
|
Y |
Y |
Y |
|
3.1 |
|
Y |
Y |
Y |
|
4.1a |
|
Y |
Y |
Y |
|
4.1b |
|
N |
N |
Y |
|
4.2 |
|
N |
N |
Y |
|
4.3 |
|
N |
N |
Y |
|
5.1a |
|
Y |
Y |
Y |
|
5.1b |
|
N |
N |
Y |
|
5.2 |
|
Y |
Y |
Y |
|
6.1 |
|
Y |
Y |
Y |
Simulation post processing:
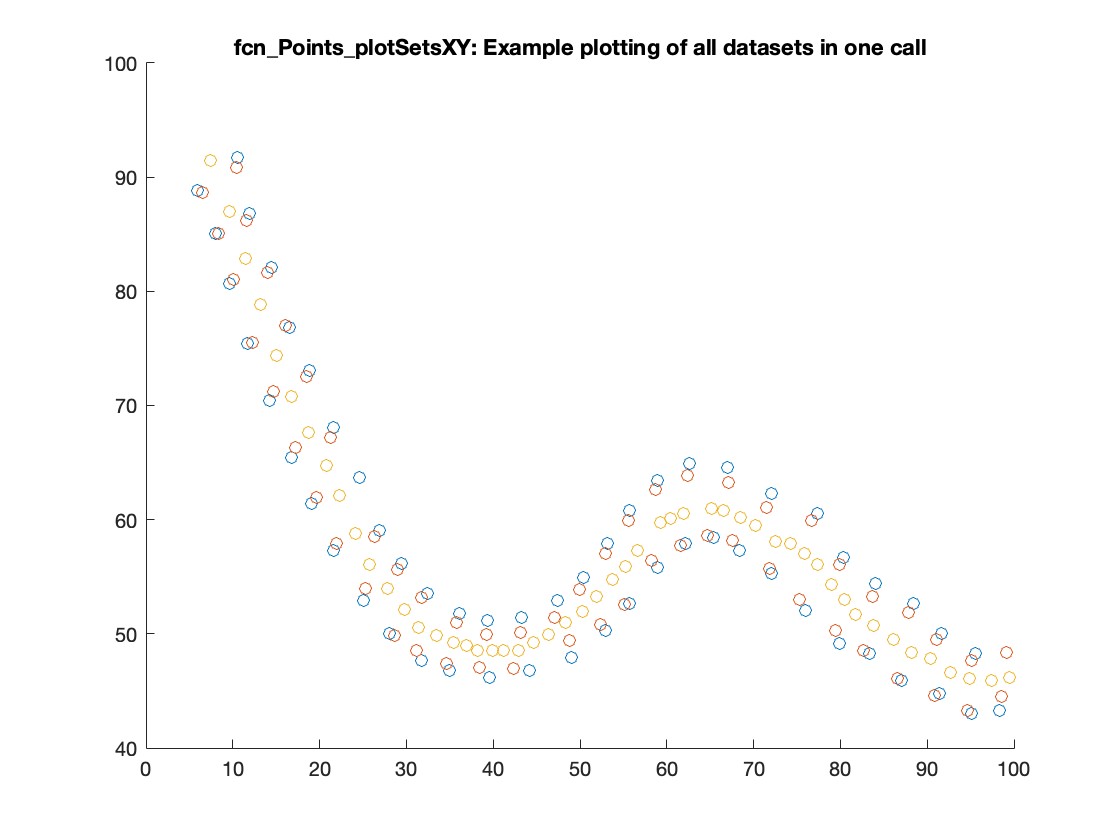
FeatureExtraction_Association_PointToPointAssociation: Functions are provided to determine matches between data sets of (X,Y) points, store and compare groups of associated points (patch objects), and determine intersections between patch objects and circular arcs (useful for collision detection).
FeatureExtraction_SafetyMetrics_SafetyMetricsClass: MATLAB code implementation of functions that perform safety metric calculations given a set of objects and a path through them.
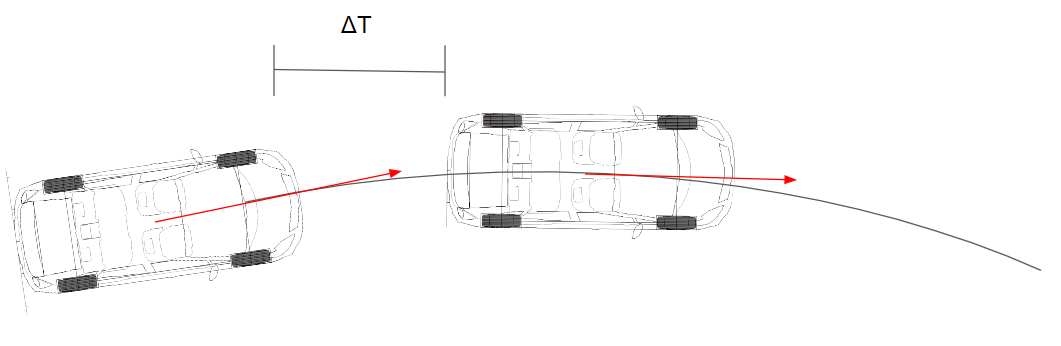
Time to collision
Demo of vehicle doing a lane change
Test track
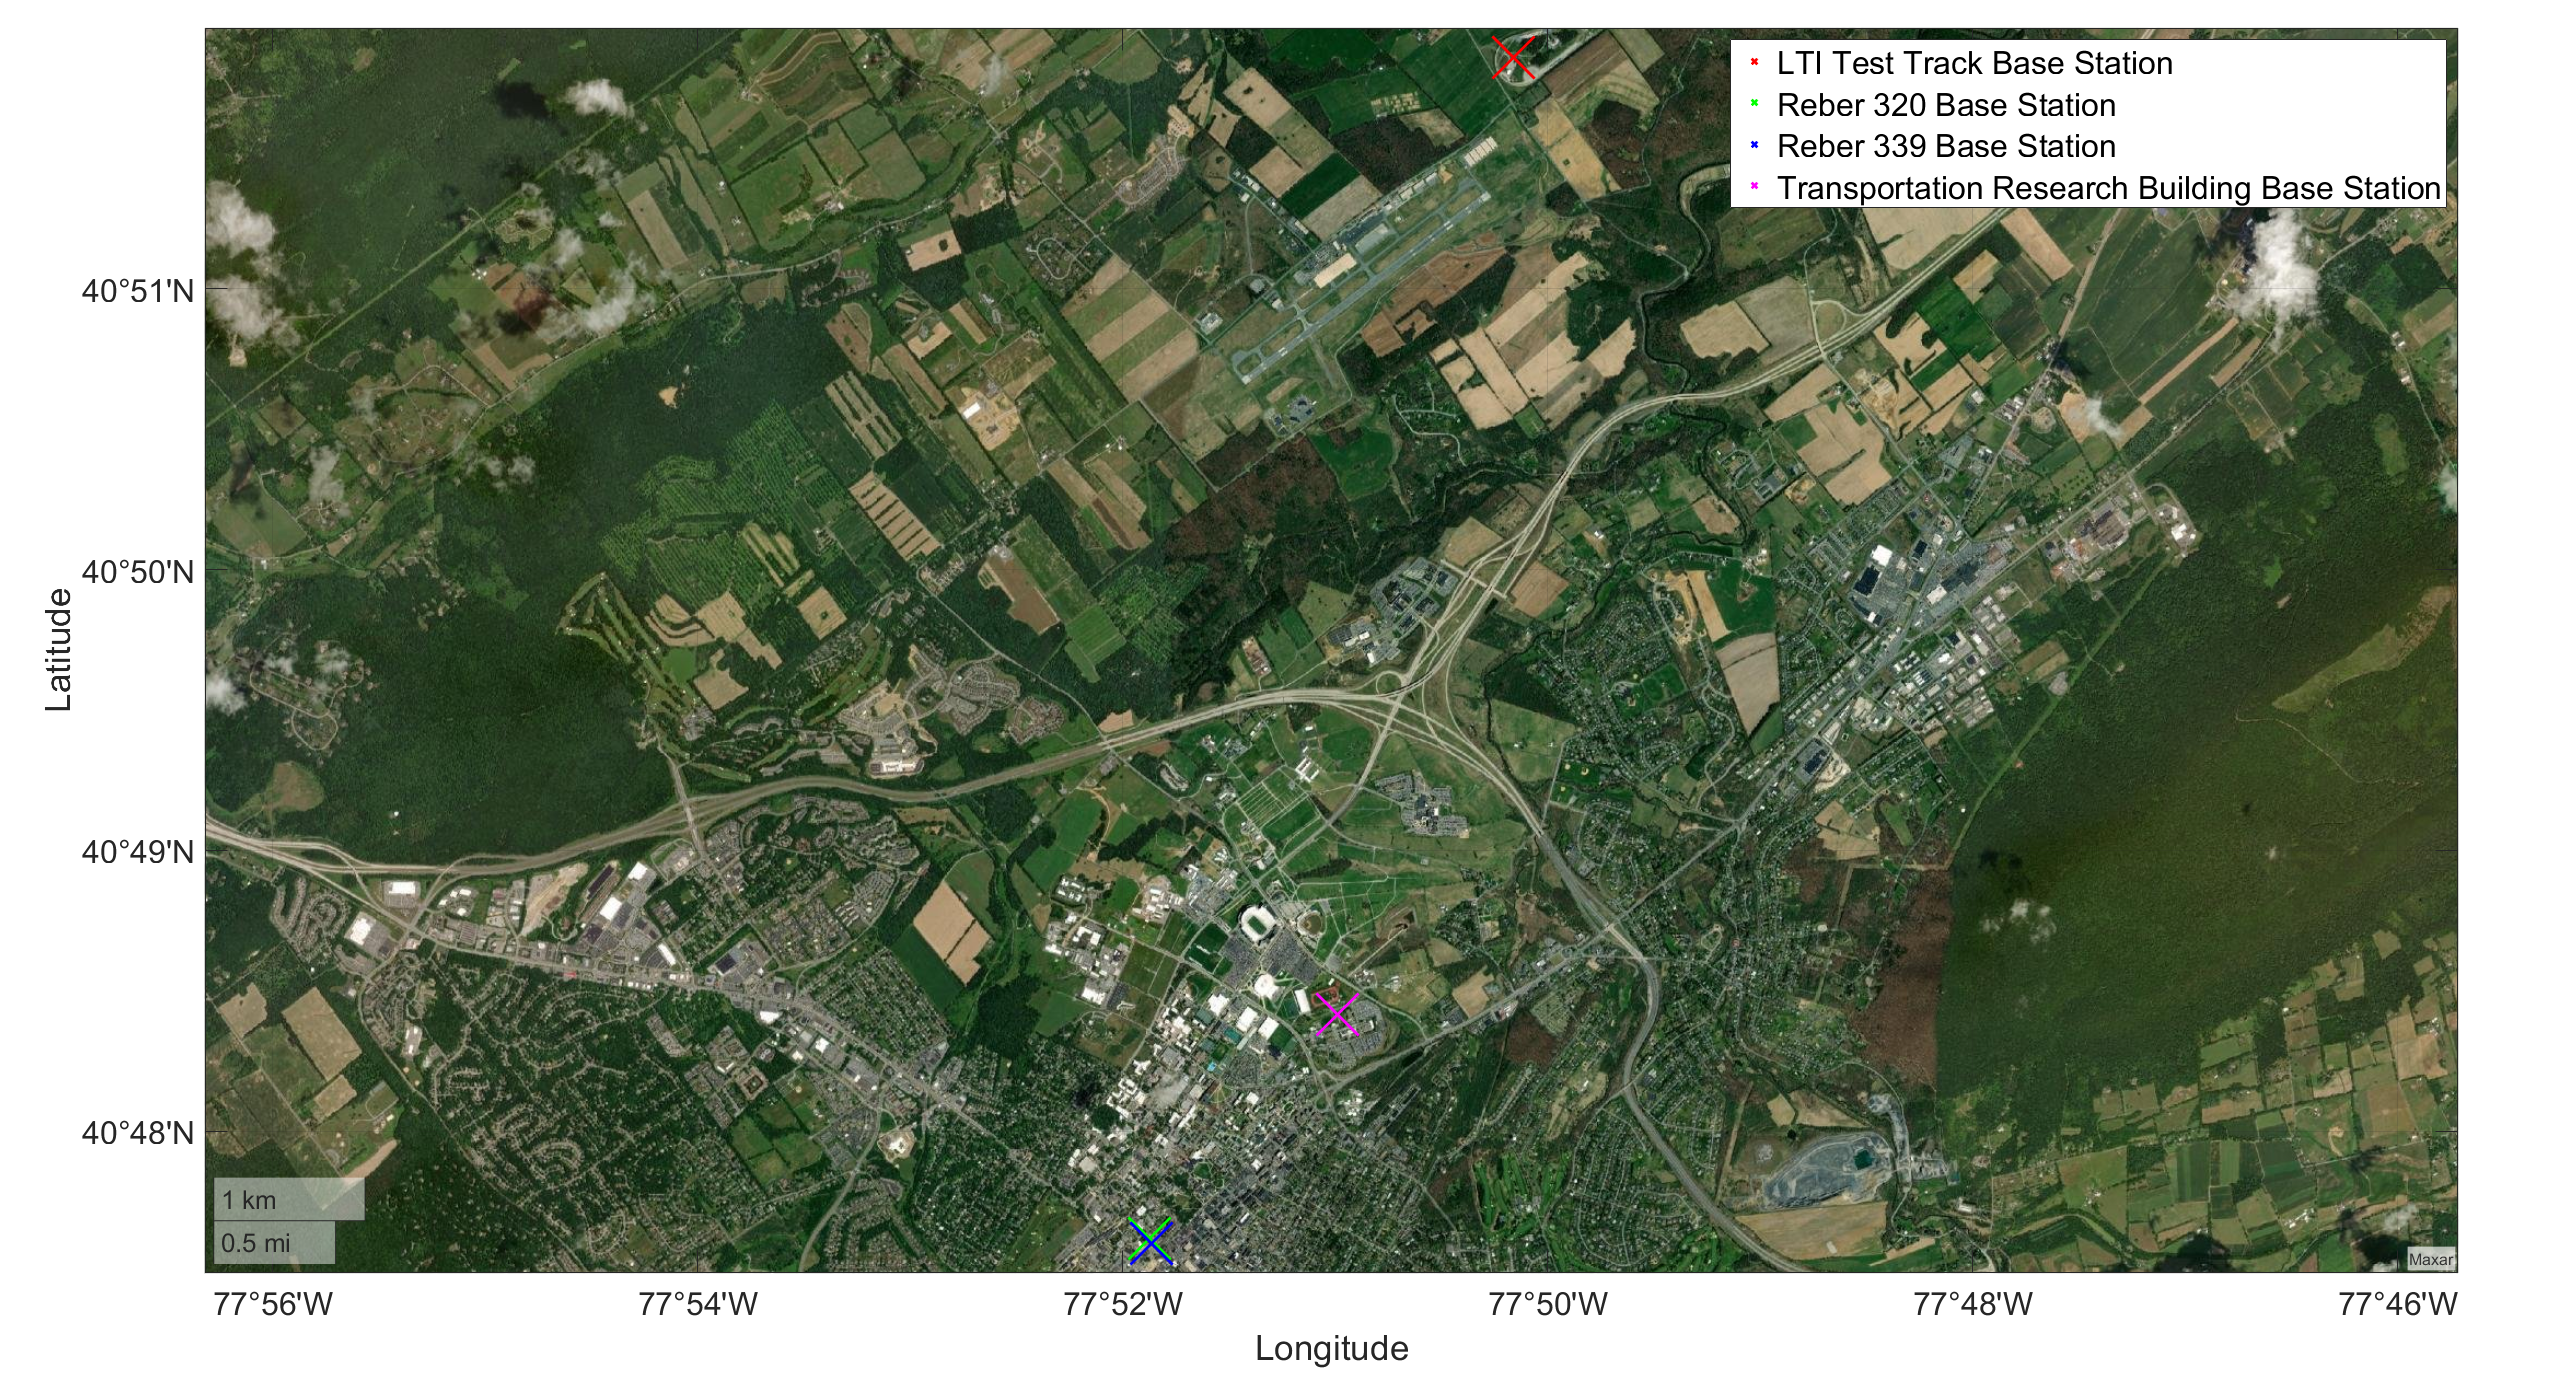
GPS and CORS Calibration
FieldDataCollection_GPSRelatedCodes_RTKCorrectionService: Setting up and using of Real-time kinematic (RTK) via Networked Transport of RTCM via Internet Protocol (NTRIP).(IVSG - PSU internal).
Data Processing
Processing GPS Data
DataProcessing_GPS_GPSConversionMethods: A repo sharing the algorithms used for GPS conversions, e.g. LLA to ENU (cloned from IVSG on 2023 04 03).
Maps and scenarios
FieldDataCollection_VisualizingFieldData_PlotWorkZone: A repo displaying the scenarios and their descriptions. (IVSG - PSU internal)
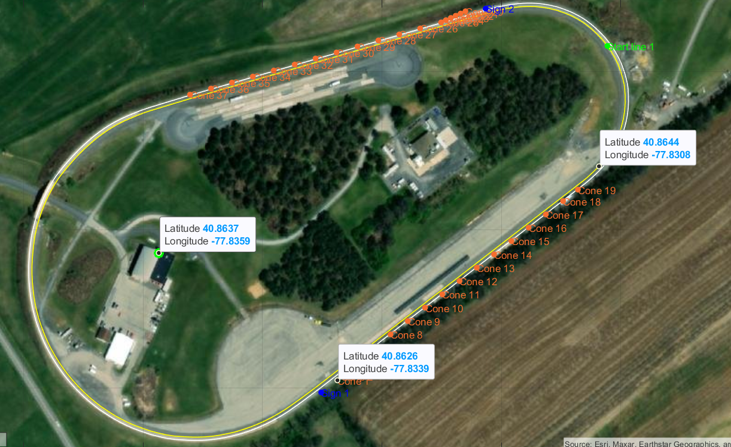
Data collection for on-track tests
Field test
To be added